


The sudden departure of Will Cathcart in June 2026 after seven years at the helm of WhatsApp shattered a foundational assumption held by enterprise go-to-market teams.
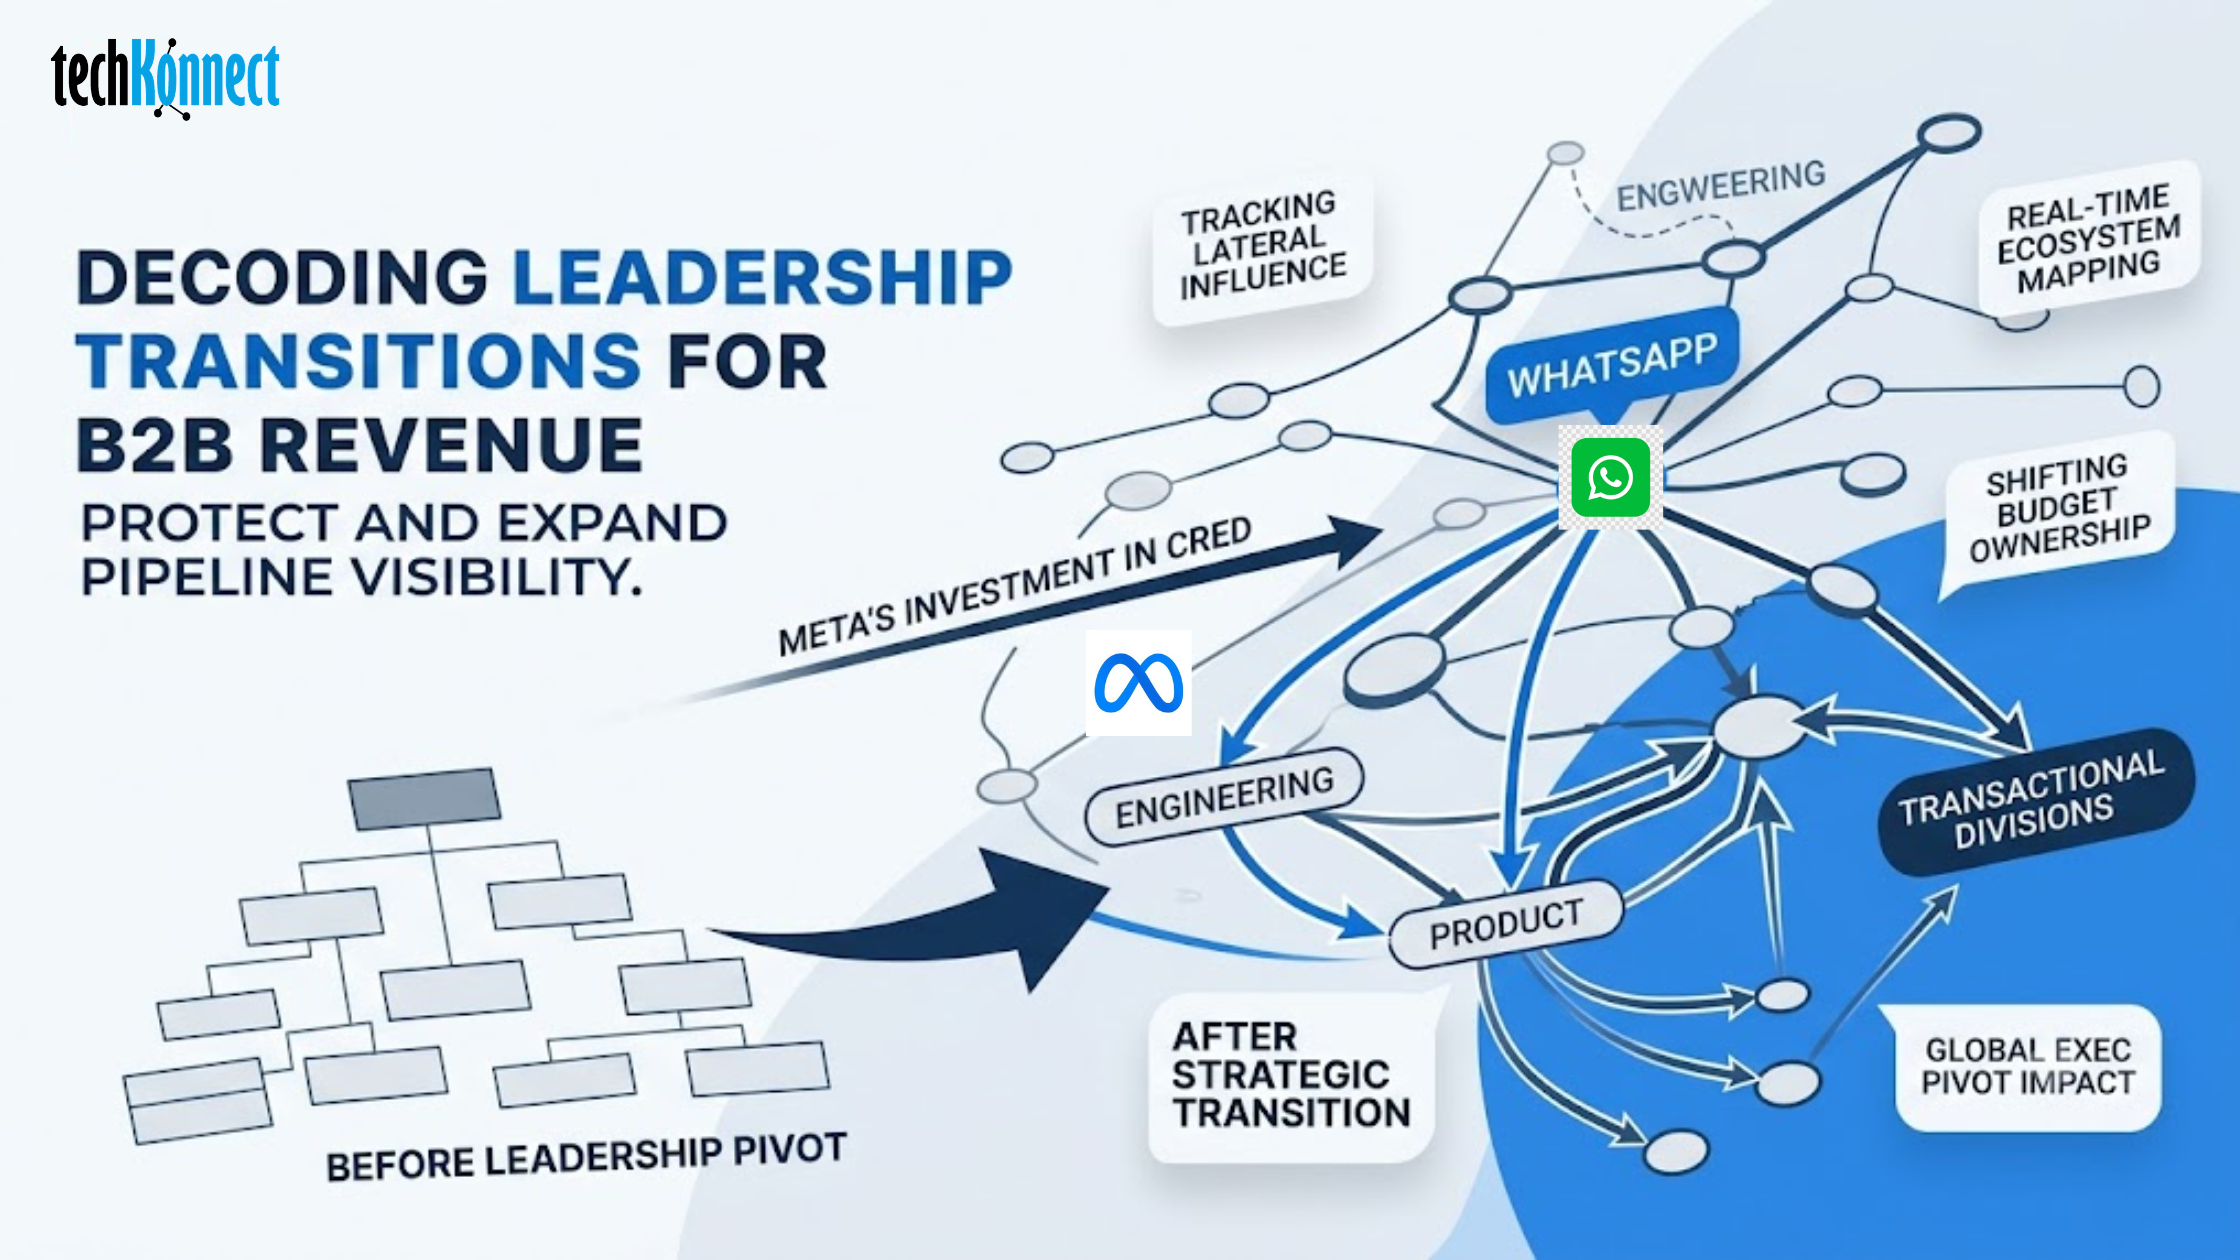
B2B enterprise vendors believed they possessed a definitive, permanent map of the decision-making framework within Meta's enterprise ecosystem. That certainty dissolved when Meta executed a major leadership pivot, appointing Kunal Shah, the founder of Indian fintech giant CRED, as the new global leader of WhatsApp. Concurrently, Meta anchored this transition with a massive $900 million investment into CRED, securing a strategic minority stake.
For enterprise commercial teams targeting global IT, telecom, and digital infrastructure enterprises, this shift is not merely an executive replacement. It represents a fundamental restructuring of strategic intent, power centers, and procurement priorities.
Legacy enterprise account maps cannot capture a transformation of this scale, forcing sales organizations to re-evaluate how they track executive movements and commercial ecosystems.
Why do traditional enterprise account maps fail when leadership pivots globally?
When a business leadership transition occurs at the highest organization, traditional database tools fall into an immediate operational deficit. Most enterprise sales teams rely on static databases that require manual verification, a workflow that lags behind real-world market movements by weeks or months.
When a global platform like WhatsApp shifts its leadership profile from a pure product-and-privacy focus to a transactional, fintech-centric focus, every node in the internal hierarchy re-aligns. Legacy company data become obsolete the moment the announcement is made.
Sellers frequently encounter a persistent operational tension:
They continue pitching to legacy engineering budgets while new strategic priorities are quietly claimed by commercial infrastructure executives.
When navigating a complex ecosystem, sales teams often look for a generic SaaS company org chart template to understand reporting lines. However, standard blueprints fail because they ignore the cross-company corporate relationships created by investments like Meta’s $900 million capital injection into CRED. The actual reporting lines are only a small part of the story. The real driver of purchasing decisions is the informal layer of influence, corporate history, and strategic alignment that new leaders bring with them.
When a vendor asks, how is a SaaS company structured?, they must look past the formal boxes to see the underlying connections that dictate how budgets are allocated.
Navigating tectonic executive shifts in four operational steps
To prevent pipeline stagnation when an enterprise account changes leadership, go-to-market teams must replace manual discovery workflows with automated, real-time visual maps. GenAI-driven actionable organization charts provide the computational speed necessary to track corporate movements as they happen.
This modern account mapping methodology functions through four distinct sequential operational steps:
1. Capture internal re-alignments immediately after an announcement.
The engine ingests cross-platform corporate filings, public announcements, and internal communications to identify exactly when an executive leaves or assumes a role. Rather than waiting for manual database updates, it immediately flags shifts in the hierarchy, tracking how adjacent reporting lines alter their operational focus.
2. Trace non-obvious relationships and corporate links.
The system maps the broader corporate ecosystem, analyzing investment ties like Meta's minority stake in CRED. By tracking the incoming executive's professional history, previous co-founders, and key operational allies, the platform predicts which auxiliary leaders will gain influence over enterprise architecture decisions.
3. Identify how budgets shift from technical to commercial teams.
The software updates the internal target profile from a rigid structural hierarchy to a dynamic functional map. It identifies how the business structure changes focus, shifting from privacy engineering to transactional communication infrastructure, allowing revenue teams to stop pitching legacy targets.
4. Deliver specific messaging for newly empowered decision makers.
The application processes the collected account intelligence to generate targeted messaging for newly empowered decision-makers. Instead of delivering generic marketing content, the platform outputs distinct talk tracks that directly align vendor solutions with the new leader's known strategic mandate.
How a fluid business structure alters the enterprise decision-making committee?
When analyzing high-growth technology organizations, sales teams frequently discover that the internal procurement engine is highly vulnerable to changes in the executive team. The introduction of an external founder to run a massive global utility indicates that the underlying corporate business structure is transitioning toward cross-functional platform monetization.
Sellers targeting telecom and enterprise communication giants can no longer treat the target account as an isolated business unit. Decisions are increasingly influenced by corporate development teams, global investment structures, and regional ecosystem partners.
Enterprise account managers using static software company org chart diagrams often miss these matrixed relationships. A traditional hierarchy chart implies that budget authority flows purely vertically. In reality, a massive capital investment across borders creates a lateral influence corridor. Executives within the invested entity suddenly gain significant input regarding platform integration, regional distribution strategies, and infrastructure vendors.
Enterprise sellers who fail to map these lateral relationships will find their proposals blocked by unexpected decision-makers who do not appear on standard corporate trees.
How to eliminate blind spots in complex IT company org charts?
For commercial teams managing large accounts, the true cost of an unmapped executive shift is the hidden erosion of the sales pipeline. A deal that appeared safe under a previous leadership regime can be quietly deprioritized if it does not align with the incoming administration's strategic agenda. Maintaining accurate, real-time visibility across complex IT company org charts is the only way to protect and expand enterprise revenue during periods of structural transition.
By applying graph-based data infrastructure to account mapping, enterprise technology vendors gain several operational advantages:
- Real-time visibility into shifting budget ownership across highly complex engineering divisions.
- Early identification of departing champions, allowing account teams to build new relationships before access is lost.
- Immediate mapping of newly formed cross-functional committees created to execute the incoming leader's new mandate.
- Strategic clarity on how regional business decisions are influenced by global investment activities.
Ultimately, winning enterprise business during periods of corporate change requires high-velocity account intelligence. Organizations that rely on legacy data structures will continue to face lengthy sales cycles and unexpected pipeline roadblocks. Conversely, teams utilizing automated, actionable insight maps can turn corporate disruption into a predictable driver of new revenue.
With these operational shifts in mind, several practical questions tend to surface during evaluation and execution. Let’s address some of them.
Frequently Asked Questions (FAQs)
Q. How do GenAI-driven org charts capture informal influence lines that are not listed on official corporate structures?
The engine reviews corporate histories, joint venture investments, past employment matches, and public operational statements. By correlating these secondary data vectors, the system highlights strong relational connections and lateral influence patterns that exist outside formal vertical reporting lines.
Q. How does tracking minority investments, such as Meta’s investment in CRED, clarify enterprise sales targets?
Corporate investments reveal hidden business dependencies. The platform identifies the strategic intersection between the two companies, flagging the specific technical divisions tasked with building integrations between the parent company's communication platforms and the partner's financial services network.
Q. Can automated relationship maps adapt to rapid structural changes without human verification delays?
Yes. The platform continuously monitors change signals across multiple public and structured corporate data repositories. When a change is detected, the graph engine automatically recalculates reporting paths and influence weights, updating the active account map without waiting for manual vendor reviews.
To secure deeper visibility into enterprise accounts and navigate unexpected global executive shifts with precision, explore the enterprise intelligence capabilities of modern dynamic mapping systems to protect your enterprise pipeline.
CLICK HERE to discover how BizKonnect transforms complex account data into real-time with actionable corporate maps that accelerate your B2B sales cycles.
CLICK HERE to know more with BizKonnect.