Chevron
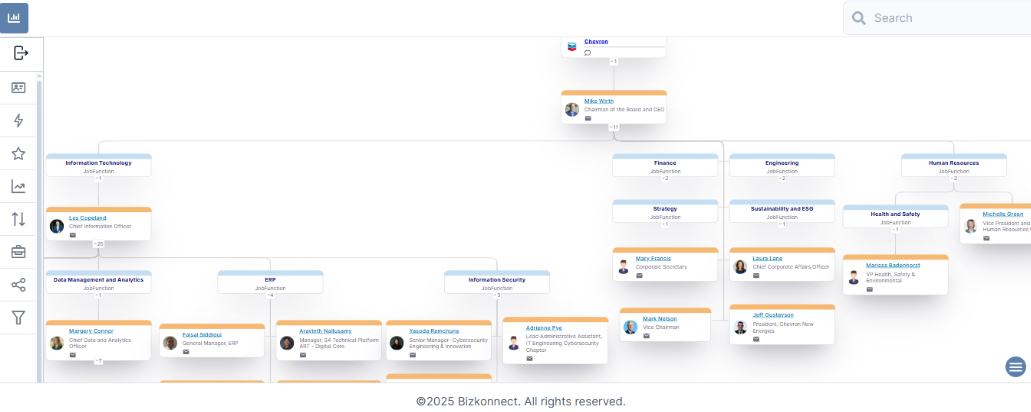
Chevron Organizational Chart - Chevron’s organizational structure connects the business through two primary segments: Upstream, which covers exploration and production, and Downstream, which includes refining, marketing, chemicals, and fuels distribution. In fiscal year 2024, Chevron reported revenue of approximately US $200 billion and net income of about US $21 billion.
Company Overview - Chevron is one of the world’s largest integrated energy companies. It operates across the oil and gas value chain, from exploration and production to refining, chemicals, and energy trading. Founded in 1879, the company also invests in lower-carbon technologies, renewable fuels, and carbon management initiatives. Chevron operates in numerous countries, managing complex regulatory environments and large-scale industrial assets.
FAQs -
1. What is the Chevron Org Chart?
It outlines how leadership accountability is organized around major asset-based business segments, with centralized oversight for capital allocation, safety, and technology standards.
2. How often does Chevron update its organizational structure?
Rather than short-term market conditions, the company’s structural changes usually follow major portfolio shifts, acquisitions, divestments, or changes in long-term capital strategy.
3. Why is the Org Chart relevant to suppliers and partners?
It helps partners understand how project ownership, procurement authority, and operational control are distributed across business units and corporate functions.
4. Which departments are most important for vendors?
Some of the major departments for vendors are upstream operations, downstream manufacturing, capital projects, supply and trading, and health, safety, and environmental functions.
5. How can marketers use Chevron’s Org Chart effectively?
By aligning outreach with asset-focused teams and corporate decision-makers, marketers can tailor proposals to long-term investment cycles, operational reliability, and regulatory priorities.