Microsoft
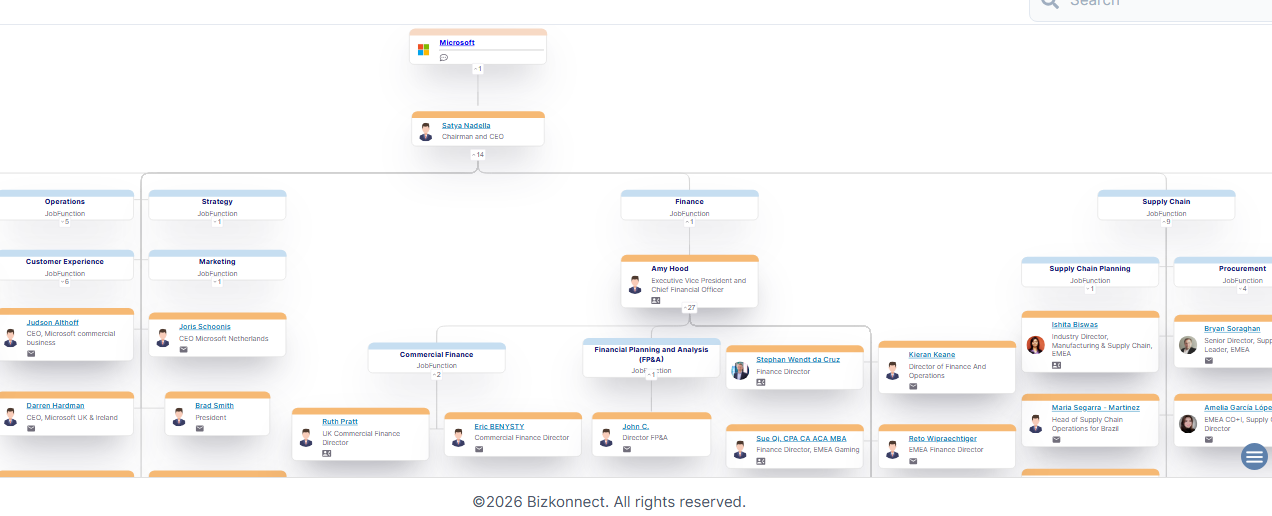
Microsoft Organizational Chart - Microsoft USA follows a structured organizational hierarchy that connects executive leadership with functional teams across the United States. The company employs over 220,000 people globally and operates through offices, engineering centers, and data centers nationwide. Its structure supports major divisions such as Cloud and AI, software, devices, security, and corporate services.
Company Overview - Microsoft Corporation, headquartered in Redmond, Washington, is one of the world’s largest technology companies. Its business spans software, cloud services, devices, enterprise solutions, and digital platforms. Microsoft is best known for products such as Windows, Microsoft 365, Azure, and LinkedIn, while also playing a major role in artificial intelligence, cybersecurity, and developer tools. The company serves consumers, businesses, and government organizations globally, with a strong focus on innovation, productivity, and long-term digital infrastructure.
FAQs -
1. What is the Microsoft USA Org Chart?
The Microsoft USA organizational chart outlines the reporting structure from the Board of Directors and executive leadership to business units such as Cloud and AI, Experiences and Devices, Security, Sales, and Corporate Functions.
2. How often does the Microsoft USA Org Chart get updated?
The org chart is updated whenever leadership roles shift or internal teams are reorganized, helping ensure accurate visibility into current reporting lines.
3. Why is the Org Chart of Microsoft USA important for B2B outreach?
It allows marketers and sales teams to understand decision-making authority, making it easier to identify relevant stakeholders across enterprise and technology functions.
4. Which functions are most relevant in the Microsoft USA Org Chart for vendors?
Functions such as cloud operations, IT, procurement, security, data, and enterprise sales are often key contact points for vendors offering B2B products or services.
5. How can marketers use the Microsoft USA Org Chart effectively?
Marketers can use the chart to identify accurate reporting structures and decision-makers. This supports focused account targeting, improves stakeholder mapping, and enables more relevant outreach within large enterprise accounts.